Estimation without estimating: how long will it take?
It’s a question that development teams dread:
There are 100 stories left until our major release. When will they be finished?
Let’s try to answer this without doing any guessing about how big stories are or how long they will take, which I’ve never been super comfortable doing. Instead we’ll look at historical data and generate a reasonable and quick forecast.
This method of estimation is quite interesting and easy to wrap your mind around. I almost titled this article “You can avoid estimating with this one weird trick”.
Getting started
My team is slicing stories as reasonably small as we can get them while still remaining valuable. I bring this up because we’re going to be counting stories to give ourselves an idea of how much we can do per sprint, and if we’re not intentional about how stories are sliced then counting may give us a false sense of progress.
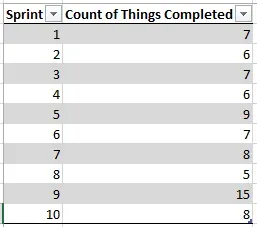
Let’s look at some data I happen to have lying around in my Work Tracking Software:

After 10 sprints our low count is 5 and our high count is 15. Awesome. Let’s do some predicting. Remember the original question: how long will it take to finish 100 things?
Easy easy easy. Look at our historical data. The least we’ve gotten done in a sprint is 5 things, so at most it’ll probably be 20 sprints (100 ÷ 5 = 20). Similarly, the most we’ve gotten done in a sprint is 15 things, so the least it will be is 7 sprints (100 ÷ 15 = 7, rounded up).

So already we have a very high confidence that the work will take between 7 and 20 sprints. That’s certainly helpful, but can we quantify that confidence? And maybe get a little more precise?
Quantifying confidence and getting more precise
Okay, this is going to sound a little weird, but here’s what we’re going to do:
We’re going to simulate one thousand potential outcomes. That is, we’re going to pretend to finish 100 stories using randomized historical data to see how long it might take, one thousand times.
Don’t panic! It’s not that hard to simulate a single potential outcome, which I’ll call a trial. And once we have one trial it won’t be difficult to scale up. Remember: we have Real Data to guide us. Check this out:
- Roll a 10-sided die (because we have 10 sprints of data)
- Whatever number comes up (x) is the sprint we’re going to look at. Check the chart above and write down the count of things completed for sprint x
- Go to step 1 until the sum of the numbers written down is greater than our target count, which is 100
- Observe how many numbers you’ve written down. That’s how many sprints it took for this particular trial
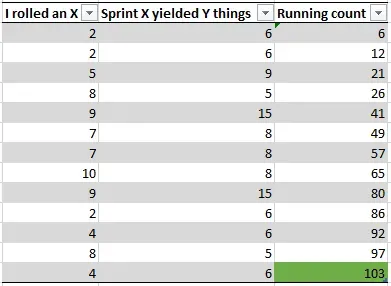
I’ll roll a trial while sitting here:

That’s all there is to it. Roll a die and select that sprint’s count until the total is above 100 and note how many times you rolled the die. This particular trial indicates that the work will be done in 13 sprints because there were 13 rolls of the die to get the count above 100.
Trial 1: 13 sprints.
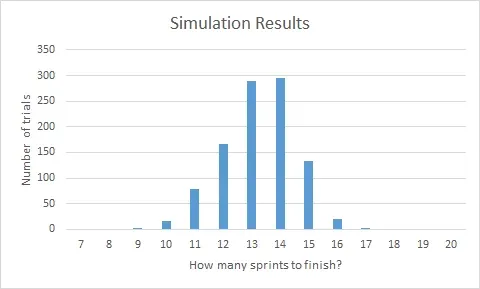
Now do that 999 more times. You can automate it if you want to; I’ll make no disparaging comments. Aloud. Anyway, you’ll start to see something like this:

Awesome. Now let’s talk about confidence intervals.
Take a look at that chart. We are 100% confident we can get the work done in 17 sprints because no trial took more than 17 iterations to complete. Conversely, if you run the numbers, we’re only 5% confident that we can finish in 11 sprints. That means, statistically, that 10 sprints and fewer are right out. So above, when we said “it could get done in as few as 7 sprints” we were way, way wrong. By a factor of at least 2, it looks like.
Here are some real confidence values:

It looks like 15 sprints is a pretty reasonable bet, but really this is a conversation you want to have with your stakeholders. How much risk are they willing to take on? For example, if they wanted to be aggressive they may want to target 13 sprints, although I would make sure they understood there’s only a 50% chance we’d make it, according to the data.
I love being able to say that: according to the data.
Wrapping things up
Where do you go from here? Why, continue collecting data, of course! Delivering an estimate is not a reason to stop communicating. As you complete each new sprint, add the ‘count of things done’ to your historical data pool and run more simulations to re-assess how closely you’re tracking to your original estimate. When things deviate, have a conversation with your stakeholders and let them know.
I really like this method of estimation because it avoids the unpleasant business of pretending I can tell the future. I don’t have to say “based on my experience this work will probably take us very long.” I can instead say “it will take this long with this confidence level. Here’s the math — I can walk you through it and the answer won’t change until we get more data, and then the answer will only be more accurate”.
And of course…
Cognitive psychology tells us that the unaided human mind is vulnerable to many fallacies and illusions because of its reliance on its memory for vivid anecdotes rather than systematic statistics. — Steven Pinker
… it’s harder to lie to yourself if you’re using data.
Further reading
This approach is called the Monte Carlo method. The guy I know of out there doing the most with this technique is Troy Magennis, who has some wonderful resources at Focused Objective’s website, including a white paper on the shape of cycle time data — a must-read if you’re doing any kind of professional estimation.
Larry Maccherone has a great visualization of the content of this article at his project Lumenize. It’s an effective way to demonstrate the power of running simulations based on historical data.
I’d also like to plug Johanna Rothman’s book Predicting the Unpredictable, which to my recollection didn’t have much in the way of Monte Carlo-based simulation, but was certainly very formative in my approach to estimation.
